|
Vincent Pica
Chief of Staff, First District, Southern Region (D1SR)
United States Coast Guard Auxiliary
|
Waves Upon, and Within, Waves
Anyone who has stood by the seashore and watched the waves roll in must have wondered at least once, “when is the next big one coming?” And, sure enough, just out in the offing, you can see one that just seems head and shoulders above the others. This column is about that.
Traditions Die Hard at Sea
You’ve seen me make that observation before and it will always be true, by my reckoning. One of those traditions is that waves come in sets of seven, meaning that every 7th wave will be like the prior wave that passed earlier. Another way to think of that is that, once a big one has crashed ashore, the next one is but seven waves ahead.
|
 |
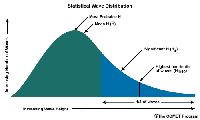
| Significant Wave Height - click to enlarge |
|
| Do the Math
Of course, that isn’t true – but it is sort of true, meaning that waves are part of a hydrodynamic system and there are statistical probabilities that do apply. One of the more quoted oceanographers in this regard is Walter Munk, who began the systemization of waves, weight heights and predictability (and measurement) of waves. He started his work during World War II and is still winning international awards and acclaim for his work in the field. Waves, or perhaps better said, “sets of waves”, are categorized by the “significant wave height” or Hsig. Hsig was intended to mathematically express the height estimated by a "trained observer".
In oceanography, the Hsig is defined traditionally as the mean wave height (trough to crest) of the highest third of the waves. But once you do that, you start to tease out the statistics of waves of varying heights arriving – and if you are a mariner out upon God’s Great Sea, this can be of intense interest…
Now this can get pretty intense, mathematically, but if you focus on the message and not on the technology, you’ll get all the information you need. Generally, the statistical distribution of the individual wave heights is well approximated by a “Rayleigh Distribution.” For example, given that Hsig= 1 meter, or 3.3 feet, statistically:
- 1 in 10 will be larger than 1.2 m (3.6 ft)
- 1 in 100 will be larger than 1.5 m (5.1 ft)
- 1 in 1000 will be larger than 1.9 m (6.2 ft)
This implies that one might encounter a wave that is roughly double the significant wave height. And remember what Hsig is – an expression of the highest 1/3rd of the waves. This means that 2/3rd are less than that. Perhaps lulling the mariner into a false sense of security?
|
 |
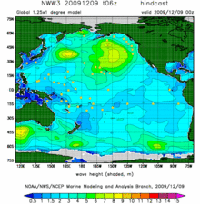
| NOAA WAVEWATCH III(R) model animation of significant wave height forecasts in the N Pacific. (click to enlarge) |
|
|
Converting that distribution into time at sea, where a wave passes your 25’ vessel every 6 seconds, the table would look like this:
- 1 every minute will be larger than 1.2 m (3.6 ft)
- 1 every 10 minutes will be larger than 1.5 m (5.1 ft)
- 1 in 100 minutes (1.7 hours) will be larger than 1.9 m (6.2 ft)
And this is when 2/3 rd of the waves are less than ~3’… And, statistically, when two significant waves come into “phase”, it is possible to encounter a wave that is much larger than the significant wave. (see SSP, “ What!? How Small a Wave Can Capsize My Boat!!?” April 13, 2011. Also, “ From Cat's Paws to Grey Beards - Wave Theory and Practice” May 12, 2010 and “ Wave Theory and Practice, Part 2”, July 21, 2010.)
|
BTW, if you are interested in being part of USCG Forces, email me at JoinUSCGAux@aol.com or go direct to the D1SR Human Resources department, who are in charge of new members matters, at DSO-HR and we will help you “get in this thing…”
|
| <-- click there to tweet, post or otherwise distribute to the 'net
Have something to add, ask or pass along? Pls do so below! I promise a response.
|
|